 |
| Photo by Gage Skidmore |
Here are the income tax rates, by income category, provided by the Congressional Budget Office:

Representative Bachmann is right. There are about 140 million Americans on the left side of the graph that aren't paying any taxes. But income taxes aren't the only federal taxes. Almost $900 billion in annual revenue is collected through payroll taxes on each and every paycheck. Another $75 billion is collected in excise taxes, such as those on gasoline. When we add these things in, things become a bit more equal.
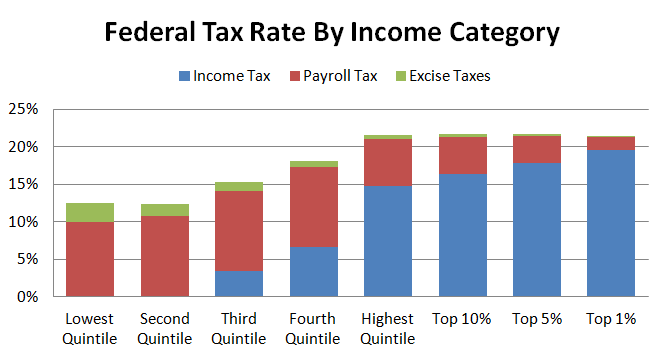
However, it's clear that federal taxes still fall disproportionately on the top 20%.
Unfortunately, those aren't the only taxes we pay. More than 40% of our yearly tax bill goes to state and local governments, mostly in the form of sales and property taxes.

When we add together all taxes, we see that "the poor" (the bottom 20%) are the ones paying the highest tax rate.
Wow. This is hard to believe. But the more you think about it, the more it makes sense. The working poor spend the highest share of their income on basic necessities like housing and transportation. This is where property and sales taxes hit the hardest.
When I started researching this, I honestly thought that I would find out that the richest Americans were paying the highest tax rates. After all, we are constantly told that our tax system is progressive, meaning that tax rates rise as income levels rise.
As it turns out, the U.S. tax system isn't progressive. Of all the groups above, the top 1% actually have the 2nd lowest tax rate. The poorest Americans have a tax rate that is 38% higher than the rate paid by the richest Americans.
Wow.
So, the next time someone tells you that 47% of Americans don't pay any taxes, show them this graph:

Sources:
Historical Effective Tax Rates: 1979-2006. Congressional Budget Office.
Additional Data on Sources of Income and High-Income Households. Congressional Budget Office.