Thursday, July 12, 2012

1992 Dream Team vs. 2012 Team USA


Kobe Bryant just announced that the 2012 U.S. Olympic Team could beat the 1992 U.S. Olympic Team (more commonly known at the Dream Team).

Michael Jordan's response: "I just laughed".

For some bizarre reason, there is no baseball today. So I'm going to break down the Dream Team vs. Team USA matchup.
Before you read the position-by-position breakdown, it's worth noting that I tend to think that the players of today are better than the players of yesteryear, across all sports. Manny Ramirez was a better player than Babe Ruth, even though Ruth has many more "Win Shares". Ruth abused his body, did no off-season training, and played against a much smaller talent pool.

In the NBA, conditioning and coaching (and defense) keeps improving. Players study more tape than they did 20 years ago. The international talent pool keeps growing. Bill Russell won 11 Championship Rings, but I bet he couldn't beat Tim Duncan 1-on-1.

With that in mind, here's my breakdown:

Position
Dream Team (1992)
Team USA (2012)
Advantage
Point Guard Magic Johnson Chris Paul Dream Team
Shooting Guard Michael Jordan Kobe Bryant Dream Team
Small Forward Larry Bird Kevin Durant Team USA
Power Forward Charles Barkley LeBron James Team USA
Center Patrick Ewing Tyson Chandler Dream Team
Bench (PG) John Stockton (PG) Russell Westbrook (PG)
Deron Williams (PG)
Team USA
Bench (SG/SF) Clyde Drexler (SG)
Chris Mullin (SF)
Scottie Pippen (SF)
James Harden (SG)
Andre Iguodala (G/F)
Carmelo Anthony (SF)
Even
Bench (PF/C) Karl Malone (PF)
Christian Laettner (PF)
David Robinson (C)
Kevin Love (PF)
Anthony Davis (PF)
Dream Team

Final Verdict: Dream Team wins, 4-3.

Comments

Point Guard
Statistically, Magic Johnson is the best point guard ever. He is frequently compared to LeBron James - a freak of nature that could play any position. I love watching Chris Paul, but he's no Magic Johnson.

Shooting Guard
I hate Kobe. Just when the team I'm rooting for (Spurs, Celtics, Suns, Thunder) is about to win, he sticks in the dagger. However, MJ is the only player I've ever seen play who had more last-second heroics. Also, MJ was 4 years younger than Kobe is now.

Small Forward
As much as I hate Kobe, I love Larry. Born in Boston, I was a huge Celtics fan in the 1980s. But Durant's better, and he finally proved to the world this year than he can carry a team as well as Bird.

Power Forward
James normally plays Small Forward. But on a team that needs size, I think his role will shift to Power Forward, where he's better than Sir Charles.

Center
The Dream Team had two Hall-Of-Fame centers: Ewing and Robinson (they each started 4 games). Chandler is fun to watch, and he's more fun to root for than Dwight Howard. But he can't compare to either of the Twin Towers of Ewing and Robinson.

Tuesday, July 10, 2012

RPG Ability Scores, Part III: Fantasy Draft

For the last installment on ability scores, a fun way to create an entire party, borrowing from the fantasy draft feature in Baseball Mogul.

Step 1: Everyone Rolls Up One Character
Each player generates one set of stats, rolling 4d6 and keeping the best 3, and recording the stats in the order rolled. The GM does the same.

Here's an example with 4 players:


Table CellAlex Beth Clay Daryl GM
STR 10 18 12 14 17
INT 14 11 11 11 17
WIS 11 9 7 12 11
DEX 12 12 10 11 14
CON 15 16 13 9 7
CHA 15 18 11 11 13

We see that Clay rolled a pretty bad character. But that's OK because he's going to pool his rolls with everyone else before divvying them up.

Step 2: Re-Rolls
Each player picks one of the stats that they rolled and re-rolls it, keeping the highest score. We are trying to build the best party, not the best character. So, Alex chooses to re-roll her WIS score, in hopes of having at least one high Wisdom score to choose from. Here are the scores after the re-rolls (shown in [bold]):


Table CellAlexBethClayDarylGM
STR1018121417
INT1411111117
WIS[12][16]71211
DEX128[13][16]14
CON15161398
CHA1518111113


Step 3: Throw Out The Boring Scores
To keep things interesting, remove the *middle* score from each row. This preserves the interesting scores (the high rolls and low rolls), but also keeps the average score near 12.2 (the average result of rolling 4d6 and keeping the best 3).

The remaining scores are the ones that players will "draft" from (shown here, sorted from high to low):


STR18171210
INT17141111
WIS1612117
DEX1614128
CON161598
CHA18151111


Step 4: "Draft" The Scores
Player #1 ("Alex") picks first. She can pick any score in the table, but she can't change what stat it applies to. If she picks the '18' in the STR row, she has to use it for Strength.

Alex wants to play a thief/rogue, so she picks the 16 DEX. Here are the characters after Round 1 of the draft:

Table CellAlex
(Thief)
Beth
(Cleric)
Clay
(Fighter)
Daryl
(Mage)
STR

[18]
INT


[17]
WIS
[16]

DEX[16]


CON


CHA


For the 2nd round, we reverse the draft order, so that Player #1 doesn't get to pick first in every round:


Table CellAlex
(Thief)
Beth
(Cleric)
Clay
(Fighter)
Daryl
(Mage)
STR[17]18
INT
17
WIS
16
DEX16
CON[15][16]
CHA[18]

And here's the completed set of characters (before racial adjustments):

Table CellAlex
(Thief)
Beth
(Cleric)
Clay
(Fighter)
Daryl
(Mage)
STR12171810
INT11141117
WIS1116712
DEX1681214
CON891516
CHA18111511

Summary: Each character gets a very good score in their primary attribute. But unlike systems that let players arrange stats as they like, they can't dump their low rolls in their least favorite stats (usually some combination of INT, WIS and CHA -- depending on character class). So you end up with some high stats in places where you wouldn't expect them (like the Thief with an 18 Charisma) and some potential weaknesses (such as the Cleric with an 8 Dexterity)

Monday, July 9, 2012

RPG Ability Scores, Part II: Counting Dice

As a follow-up to yesterday's post about generating ability scores that are both random and balanced, here's a system that treats all six ability scores equally, and more easily adjusts to different power levels.

Step 1: Roll 14d6
Note: For a "low-powered" campaign, use 12d6. For a "high-powered" campaign, use 16d6 (or more).

If more than 8 dice show the same result, re-roll the extra dice.

Step 2: Count the Dice
Count up all the dice showing '1'. The number of 1's determines your Strength score using the following table:

Dice
Score
Dice
Score
0
8
5
16
1
10
6
17-
2
12
7
17+
3
14
8
18
4
15


Repeat this process for all the 2's (INT), 3's (WIS), 4's (DEX), 5's (CON) and 6's (CHA).

Step 3: Tweak The Totals

If you recorded "17-" or "17+" for any of your scores, do the following:

1. If you rolled a "17-" and "17+", ignore them (they cancel each other out).
2. If you rolled a "17-", subtract one point from any ability score (not reducing any score below 8).
3. If you rolled a "17+", add one point to any ability score (not raising any score above 14).

Step 4. Re-Arrange

I prefer to simply swap any two scores at this point. It ensures that you get a variety of characters. But you can use whatever system suits your campaign.

Friday, July 6, 2012

RPG Ability Scores, Part I: Random *and* Balanced

Putting on my nerd hat for a minute. Ever since the late 1970s, I've struggled with the problem of generating ability scores in tabletop role-playing games (this problem also carries over into CRPGs and MMOs).

In the original
Dungeons & Dragons, ability scores (such as Strength and Dexterity) were rolled using 3d6. It was a lot of fun "rolling up" stats, seeing your character come to life before your eyes. But the randomness was really unsatisfying (and unfair). My cousin always had the knack of rolling about three 18s for each character, while the rest of us stumbled around with an 8 Dexterity and 3 Charisma (yes, my first D&D character actually had a 3 ar

In 1979, my best friend bought me a copy of the
Champions role-playing game (now part of the Hero System). Characters were no longer random. You had a fixed number of points to divide among your various characteristics and abilities. It was great have every character built on an equal footing. But we lost the fun of "rolling up a character".

Also, point-buy systems lead to all characters being the same. For example, all fighters will "max out" their Strength and spend the fewest points on less useful characteristics (like Charisma).

To solve these problems, h
ere is the system I use in my own RPG, but it also works in most iterations of Dungeons & Dragons.
You may notice that I'm determining ability scores in the same order in which they were presented in the original Advanced Dungeons and Dragons (now referred as "1st Edition"). As I said, I've been pondering this problem since the 1970s.

Step 1: Roll Your Ability Scores
Determine each of the first four ability (STR, INT, WIS, DEX) scores randomly, by rolling 4d6 and keeping the best three. Record the abilities in the order in which you roll them. Set any roll below 8 equal to 8.

Step 2: Add Up The Point Cost

Using the following table, add up the point cost of the ability scores that you already rolled.

Table 1: Ability Score Point Cost
Score
Cost
Score
Cost
8
0
14
6
9
1
15
8
10
2
16
10
11
3
17
13
12
4
18
16
13
5


If the total cost of your first four ability scores is below 4 or above 25, go back to Step 1 and re-roll those scores.

Step 3: Complete Your Ability Scores
To determine your final 2 ability scores, look up the total cost (from Step 2) on the following table:

Total
Cost
CON
CHA
Total
Cost
CON
CHA
4
18
13
15
10
15
5
12
18
16
14
11
6
14
17
17
10
14
7
17
13
18
10
13
8
17
12
19
13
9
9
11
17
20
12
9
10
13
16
21
8
12
11
16
12
22
9
10
12
16
11
23
10
8
13
10
16
24
9
8
14
15
11
25
8
8

After filling in your CON and CHA scores, you may swap any two scores.

I find that this is a great way to create random characters that are also balanced. And the final swap at the end gives you just enough control to create a playable character that still has some interesting quirks.

Saturday, June 23, 2012

Baseball Contract Analysis

We've been going through contract and salary data, in order to improve the artificial intelligence in Baseball Mogul 2013 and future versions.

Contract Lengths for Major League Baseball Players (n = 516)
We examined the 516 players on Major League 40-Man Rosters (as of opening day) that had reached either arbitration or free agency. The first fact worth noting is that the vast majority (84%) of all player contracts are between 1 and 3 years. The longer deals get all the headlines, but the shorter deals dominate team rosters.

In fact, more than half of the contracts (almost 53%) were for just one year. As might be expected, these one-year contracts were at the lowest salary levels. They were also awarded to older players (age 31.2) showing that one-year contracts are used primarily to sign journeymen that fill out the roster and provide depth in case of injury.

Contract Length Players Share Average Salary Average Age
1 Year 272 52.7% $3.51 Million 31.2
2 Years 126 24.4% $4.86 Million 31.4
3 Years 34 6.6% $7.80 Million 29.7
4 Years 22 4.3% $9.45 Million 28.9
5 Years 203.9% $10.16 Million 28.5
6 Years 26 5.0% $13.01 Million 28.7
7+ Years 16 3.2% $19.18 Million 30.1

Of the 272 players with 1-year contracts, almost half (42%) had been awarded those contracts during arbitration. The average age of players with contracts awarded in arbitration was 28.6. If we remove those contracts from the pool of 1-year contracts, the average age rises above 33.

1-Year Contracts Players Share Average Salary Average Age
Arbitration 113 21.9% $4.41 Million 28.6
Non-Arbitration 159 30.8% $2.24 Million 33.1

Finally, if we look at the "Overall" rating assigned by Baseball Mogul, we see that the longer contracts at higher salary levels are awarded to the more talented players.

(Here is the data with the arbitration contracts split out from the pool of 1-year players)

Contract Length Players Overall Rating Average Age Average Age
at Signing
(Arbitration) 113 78.9 28.6 28.6
1 Year 159 79.9 33.1 33.1
2 Years 126 81.4 31.4 30.8
3 Years 34 84.7 29.7 28.6
4 Years 22 85.6 28.9 27.4
5 Years 2085.0 28.5 26.5
6 Years 26 88.2 28.7 26.1
7+ Years 16 90.7 30.1 26.6

It seems that the youngest group of players are those with 5-year contracts, with the average age rising again for 6-year and 7-year contracts. However, if we instead calculate the average age at which the contract was signed, we see a steady downward trend towards signing younger players to longer deals. This would seem to go against the conventional wisdom which holds that players don't sign deals of this magnitude (7+ years) until their late 20s (or early 30s), when they have had enough time to prove their worth on the free agent market.

Wednesday, June 20, 2012

Windows Screen Resolutions (and Operating Systems)

Baseball Mogul 2013 in a 640x480 window
Just an update for game designers and web designers, since it can be hard to find all of this information in one place. The following is a list of the most popular screen resolutions for Windows machines:

Resolution Share Width Height Ratio Type
1366x768 20.8% 1366 768 1.78 Widescreen (16:9)
1024x768 17.5% 1024 768 1.33 Video (4:3)
1280x800 12.1% 1280 800 1.60 Widescreen (8:5)
1280x1024 7.0% 1280 1024 1.25 Video (5:4)
1440x900 6.4% 1440 900 1.60 Widescreen (8:5)
1920x1080 5.6% 1920 1080 1.78 Widescreen (16:9)
1600x900 4.1% 1600 900 1.78 Widescreen (16:9)
1680x1050 3.6% 1680 1050 1.60 Widescreen (8:5)
768x1024 2.4% 768 1024 0.75 Vertical (3:4)
1360x768 2.4% 1360 768 1.77 Widescreen (16:9)
1024x600 2.2% 1024 600 1.71 Widescreen (5:3)
1280x720 1.6% 1280 720 1.78 Widescreen (16:9)
1280x768 1.5% 1280 768 1.67 Widescreen (5:3)
1152x864 1.4% 1152 864 1.33 Video (4:3)
1920x1200 1.1% 1920 1200 1.60 Widescreen (8:5)
800x600 0.9% 800 600 1.33 Video (4:3)
1280x960 0.7% 1280 960 1.33 Video (4:3)
1093x614 0.6% 1093 614 1.78 Widescreen (16:9)
2560x1440 0.4% 2560 1440 1.78 Widescreen (16:9)
1311x737 0.4% 1311 737 1.78 Widescreen (16:9)
Other 7.5%

Some facts to take away:
  • "1024 x 768" is no longer the most common screen resolution.
  • About 96% of Windows machines have a width of 1024 pixels or more.
  • About 75% of Windows machines have a width of 1200 pixels or more.
  • About 65% of screens are now "widescreen". That is, they have an aspect ratio closer to the new High Definition format (16:9) than the old Low Definition format (4:3). 
  • A significant share of monitors (probably 3-5%) are being used vertically.
And here's the operating system breakdown (among Windows machines):


Windows 7 Windows Vista Windows XP
Game Players 69.6% 12.6% 17.8%
Classrooms 62.8% 4.9% 32.3%
Installed Base 50.6%11.3% 38.1%
Average 61.0% 9.6% 29.4%

Tuesday, May 29, 2012

Pythagoras Explained


Pythagoras of Samos, mathematician and philosopher, died about 2500 years ago. Nevertheless, his name is familiar to baseball fans. The "Pythagorean Expectation", invented by Bill James in the 1980s, predicts a team's winning percentage from runs scored and runs allowed. Despite the intimidating name, Pythagorean win expectations can now be found on mainstream sites like ESPN and MLB.com.


The Pythagorean Theorem

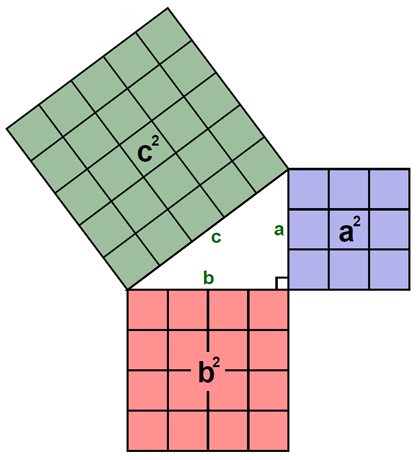
The original Pythagorean Theorem states the following for right triangles (triangles with a 90-degree angle):

The square of the longest side equals the sum of the squares of the two shorter sides.

To put it visually, the area of square 'c' always equals the combined areas of squares 'a' and 'b':


Pythagorean Expectations

James' Pythagorean Expectation uses a similar formula to express the fact that a team's winning percentage can be predicted by comparing the square of the team's runs scored to the square of the team's runs allowed.

Specifically, the ratio of wins to losses correlates with the ratio of those two squares:

Wins : Losses   =   Runs Scored 2 : Runs Allowed 2

The reason this formula evokes Pythagoras' name can be seen in this diagram. If the lengths of each side are represented by a team's runs scored and allowed, their balance of wins to losses is shown by the area of the squares.


Take the 2004 Red Sox as an example. They scored 949 runs while only allowing 768.
  • 949 = 900601
  • 768 = 589824
  • Projected Winning Percentage = Projected Wins / (Projected Wins + Projected Losses)
  • Projected Winning Percentage = 900601 / (900601 +  589824)
  • Projected Winning Percentage = .604 (98 - 64)
A .604 winning percentage in a 162-game season equals a record of 98-64. In real life, the 2004 Red Sox were 98-64. So, as some stat nerds might say, "Pythagoras was right".

Player Value

Predicting team winning percentage is useful, but the Holy Grail for general managers is a formula that determines player value. So, we use the Pythagorean formula to determine how many runs a player needs to create (or prevent) for that team to win one more game than it would otherwise.

If a team scores 810 runs and allows 810 runs, we can predict a winning percentage of .500. That is, the team should go 81-81 over a 162-game season.

For a team that scores 820 runs but still allows 810, the Pythagorean formula predicts a winning percentage of .506. This corresponds to a record of 82-80. In other words, 10 additional runs are needed to turn one loss into a win.

This is the math that underpins modern player valuation techniques such as Wins Above Replacement (WAR). By analyzing thousands of games over the last 50+ years, we calculate how many runs each play creates. For example, a double creates about 0.85 runs. A home run creates about 1.40 runs.

Then, if the above team adds a player in the off-season who contributes 21 more doubles and 30 more home runs than the player he replaces, that will create an additional 59.85 runs (21 * 0.85 + 30 * 1.40). Since every 10 runs creates an additional win, this player will add about 6 wins to the team's projected won-loss record.

The same math is used for pitching and defense. If a center fielder with great range converts 20 doubles into outs over the course of a season, he has prevented the opposition from scoring about 17 runs -- the equivalent of 1.7 wins.