| Rank | Team | Overall | Run Blocking | Pass Blocking | 2010 Rank |
| 1 | New Orleans Saints | 94 | 94 | 94 | 1 |
| 2 | Carolina Panthers | 92.5 | 98 | 87 | 4 |
| 3 | Tennessee Titans | 89 | 85 | 93 | 2 |
| 4 | Minnesota Vikings | 87.5 | 95 | 80 | 10 |
| 5 | New England Patriots | 87 | 82 | 92 | 5 |
| 6 | Baltimore Ravens | 86.5 | 90 | 83 | 7 |
| 7 | Atlanta Falcons | 85.5 | 81 | 90 | 6 |
| 8 | Denver Broncos | 85.5 | 86 | 85 | 14 |
| 9 | Cincinnati Bengals | 85.0 | 79 | 91 | 16 |
| 10 | New York Jets | 84.5 | 84 | 85 | 3 |
| 11 | Buffalo Bills | 84.5 | 89 | 80 | 26 |
| 12 | New York Giants | 84.0 | 79 | 89 | 13 |
| 13 | Houston Texans | 83.5 | 79 | 88 | 20 |
| 14 | San Diego Chargers | 83.5 | 76 | 91 | 19 |
| 15 | Dallas Cowboys | 83.5 | 85 | 82 | 9 |
| 16 | San Francisco 49ers | 83.0 | 85 | 81 | 18 |
| 17 | Philadelphia Eagles | 83.0 | 84 | 82 | 21 |
| 18 | Arizona Cardinals | 82.5 | 81 | 84 | 11 |
| 19 | Green Bay Packers | 82.0 | 86 | 78 | 22 |
| 20 | Detroit Lions | 81.5 | 81 | 82 | 28 |
| 21 | Oakland Raiders | 81.5 | 83 | 80 | 29 |
| 22 | Jacksonville Jaguars | 81.0 | 86 | 76 | 17 |
| 23 | Miami Dolphins | 81.0 | 86 | 76 | 8 |
| 24 | Tampa Bay Buccaneers | 80.5 | 76 | 85 | 25 |
| 25 | Cleveland Browns | 80.0 | 76 | 84 | 15 |
| 26 | Chicago Bears | 79.0 | 77 | 81 | 24 |
| 27 | Pittsburgh Steelers | 78.5 | 83 | 74 | 27 |
| 28 | Kansas City Chiefs | 78.5 | 80 | 77 | 23 |
| 29 | Indianapolis Colts | 77.0 | 74 | 80 | 12 |
| 30 | Seattle Seahawks | 73.0 | 75 | 71 | 30 |
| 31 | Washington Redskins | 73.0 | 76 | 70 | 32 |
| 32 | St. Louis Rams | 72.0 | 76 | 68 | 31 |
Saturday, July 23, 2011
2011 Offensive Line Rankings
Based on career stats for all active linemen (adjusted for age, and weighted for recent performance and injuries) here are ratings for the current offensive lines for all 32 NFL teams. For individual ratings for each offensive lineman, you can download this year's version of Football Mogul, which is 100% free (no time limits or registration required).

Sunday, June 12, 2011
We Are The 53%!
 |
| Photo by Gage Skidmore |
Here are the income tax rates, by income category, provided by the Congressional Budget Office:

Representative Bachmann is right. There are about 140 million Americans on the left side of the graph that aren't paying any taxes. But income taxes aren't the only federal taxes. Almost $900 billion in annual revenue is collected through payroll taxes on each and every paycheck. Another $75 billion is collected in excise taxes, such as those on gasoline. When we add these things in, things become a bit more equal.
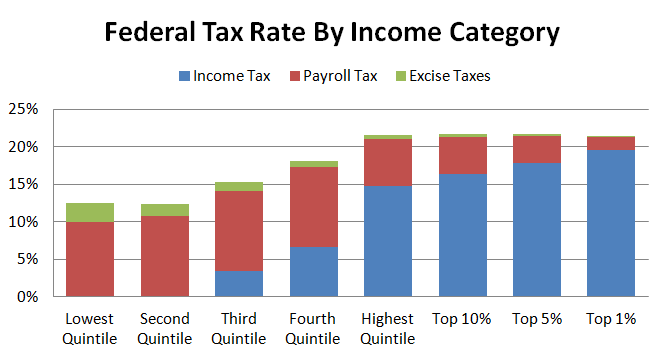
However, it's clear that federal taxes still fall disproportionately on the top 20%.
Unfortunately, those aren't the only taxes we pay. More than 40% of our yearly tax bill goes to state and local governments, mostly in the form of sales and property taxes.

When we add together all taxes, we see that "the poor" (the bottom 20%) are the ones paying the highest tax rate.
Wow. This is hard to believe. But the more you think about it, the more it makes sense. The working poor spend the highest share of their income on basic necessities like housing and transportation. This is where property and sales taxes hit the hardest.
When I started researching this, I honestly thought that I would find out that the richest Americans were paying the highest tax rates. After all, we are constantly told that our tax system is progressive, meaning that tax rates rise as income levels rise.
As it turns out, the U.S. tax system isn't progressive. Of all the groups above, the top 1% actually have the 2nd lowest tax rate. The poorest Americans have a tax rate that is 38% higher than the rate paid by the richest Americans.
Wow.
So, the next time someone tells you that 47% of Americans don't pay any taxes, show them this graph:

Sources:
Historical Effective Tax Rates: 1979-2006. Congressional Budget Office.
Additional Data on Sources of Income and High-Income Households. Congressional Budget Office.
Friday, March 25, 2011
"Meteorologist" Fails At Math
Further proof that our political discourse is no longer about facts. It's just about using data to express your opinion:
IPCC Claims 17cm of Sea Level Rise Made the Tsunami Worse
Mr. Watts is clearly an intelligent and apparently well-educated person. But he makes a giant logic error because it fits with his view that climate change is harmless.
Dr. Pachauri at the IPCC notes:
“In the 20th century, sea-level rise was recorded at an average of 17 centimetres. If the sea-level was significantly lower, clearly the same tsunami would have had a less devastating effect.“
Mr. Watts states:
"clearly Dr. Pachauri can’t mentally manage the concept of scale."
He then uses this lovely graphic to show that the size of the tsunami (17m) is much bigger than the sea-level rise (14cm):

And then draws the conclusion that the sea-level raise did not make the tsunami worse at all.
But the logical failure is that something being big and something being small doesn't automatically mean that the small thing doesn't exist.
The sea level rise made the tsunami 1.2% higher. That's not a lot. But it's not "nothing". Using these numbers, we could assume that the sea level rise increased the "devastation" by 1.2%. But that would be understating the effect of the sea level rises.
If a 14-meter tsunami killed 18,000 people, does that mean that a 7-meter tsunami would have killed 9,000 people? It's unlikely. We know that the area was fairly well prepared for a tsunami of about 5 meters -- primarily through a 5.7 meter sea wall built to handle such an event.
So a 3.5-meter tsunami would have caused very little damage. A 7-meter tsunami would have caused more damage, but much of it would have been allayed by defenses in place. The following table seems plausible. It is certainly more plausible than assuming a linear relationship (or, as Mr. Watts would prefer, no relationship):
| Height | "Devastation Units" |
| 3.5 meters | 0 |
| 7 meters | 10 |
| 10.5 meters | 40 |
| 14 meters | 90 |
This is the same effect we see in baseball, where runs scored has an exponential effect on wins. Scoring twice as many runs as an average team will lead to a win-loss ratio that is four times higher.
So, let's assume that a 17 cm (1.2%) increase in the size of the tsunami caused about 3% more "devastation":
The tsunami caused $300 billion in damage. Three percent of that is $9 billion. Nine billion dollars.
The tsunami killed more than 18,000 people. The sea level rise is responsible for more than 500 of these deaths.
I understand that most of the damage was caused by the earthquake. But some of it was attributable to the sea-level rise, including the deaths of more than 500 people. This is in a country with about 500 homicide per year. If Japan managed to completely eliminate all homicides, that would be front page news. But Mr. Watts would like to write off these deaths from sea-level rise as if they never happened.
Sunday, January 16, 2011
Go For Two!
 |
| Photo by Keith Allison |
With less than two minutes left in the game, the Patriots scored a touchdown and kicked the extra point, to bring themselves within 7 points of the Jets.
Before the score, the Patriots were down 31-17. It's pretty clear at this point in the game that the only way the Patriots could win is to score two touchdowns while preventing the Jets from scoring.
So, any assessment of the correct strategy should assume that the Pats will score two touchdowns while holding New York scoreless.
The league average success rate for 2-point conversions is 47.9%. Using this rate, it doesn't make sense to "go for 2" if you can tie the game by kicking the extra point. Here's a quick example of how the math works out in that situation (when the trailing team is behind by just 1 point after scoring the touchdown, but before the point-after):
(PAT success is 98.7%):
1) Team scores touchdown to bring score within 1 point. Team kicks extra point.
Chance of leading after this score: 0%.
Chance of being tied after this score: 98.7%.
Chance of trailing after this score: 1.3%.
2) Team scores touchdown to bring score within 1 point. Team goes for two.
Chance of leading after this score: 47.9%.
Chance of being tied after this score: 0%.
Chance of trailing after this score: 52.1%.
A team that ends the game in the lead wins that game. If they end the game trailing on the scoreboard, they lose. All things being equal, a team that ends the game tied has a 50% chance of winning that game.
So, we can award 1.0 wins for a result that puts the team in the lead; 0.5 wins for a result that ties the game; and 0.0 wins for a result after which the scoring team is still trailing.
Using those values, kicking the extra point produces 0.4935 wins but going for two results in only 0.4790 wins.
However, if the trailing team needs *two* touchdowns, the math is totally different.
1) Team trails by 14 points and scores two touchdowns. Team never goes for two:
Chance of leading after both scores: 0%.
Chance of being tied after both scores: 97.42%.
Chance of trailing after both scores: 2.58%.
2) Team trails by 14 points and goes for two after the first touchdown:
Chance of pulling within 6 points: 47.9%.
Chance of pulling within 7 points: 0%.
Chance of pulling within 8 points: 52.1%.
Then, when the team scores a 2nd time, they kick the extra point *if it would give them the lead*. If the team scored 8 points with the first touchdown, they have already tied the game before kicking the extra point.
2a) Team trails by 6 points before the touchdown, and kicks the extra point:
Chance of leading after both scores: 98.7%.
Chance of being tied after both scores: 1.3%.
Chance of trailing after both scores: 0.0%.
If the two-point conversion failed on the first touchdown, the team has to go for two in an attempt to just tie the game:
2b) Team trails by 8 points before the touchdown, and goes for two:
Chance of leading after this score: 0.0%.
Chance of being tied after this score: 47.9%.
Chance of trailing after this score: 52.1%.
To see the overall chance of winning the game with this strategy (going for two after the first touchdown), we have to combine the odds from 2a and 2b:
2) Team trails by 14 points and goes for two after the first touchdown
Chance of leading after both scores: 47.28%.
Chance of being tied after both scores: 25.58%.
Chance of trailing after both scores: 27.14%.
Assuming a 50% chance of winning tie games, here's what we get:
Going for two after the first score: .6007 wins
Kicking the extra point after the first score: .4866 wins
Going for two after the first score increases the chance to win the game by 23.4%. That's a huge difference (and one that Belichick shouldn't have passed up).
The key is that when you know that you need *two* touchdowns, you can make the decision whether to go for 2 on the second touchdown, *already knowing whether you had a successful conversion on the first touchdown*. If you weren't successful, then you need to go for two to tie the game. But if you succeeded on the first touchdown, you can just kick the extra point on the second touchdown, and win the game by 1 point.
Wednesday, August 25, 2010
2010 Offensive Line Rankings
Based on stats from the last 12 seasons (yes, Matt Birk has been in the league since 1998), here are ratings for the current offensive lines for all 32 NFL teams.
For more information on each offensive lineman, check out the individual ratings in Football Mogul.
| Rank | Team | Overall | Run Blocking | Pass Blocking |
| 1 | New Orleans Saints | 95 | 95 | 93 |
| 2 | Tennessee Titans | 94 | 95 | 92 |
| 3 | New York Jets | 92 | 94 | 89 |
| 4 | Carolina Panthers | 92 | 94 | 88 |
| 5 | New England Patriots | 91 | 84 | 97 |
| 6 | Atlanta Falcons | 90 | 85 | 93 |
| 7 | Baltimore Ravens | 89 | 94 | 83 |
| 8 | Miami Dolphins | 88 | 93 | 82 |
| 9 | Dallas Cowboys | 88 | 91 | 86 |
| 10 | Minnesota Vikings | 87 | 92 | 83 |
| 11 | Arizona Cardinals | 87 | 81 | 93 |
| 12 | Indianapolis Colts | 86 | 75 | 97 |
| 13 | New York Giants | 86 | 82 | 89 |
| 14 | Denver Broncos | 85 | 81 | 89 |
| 15 | Cleveland Browns | 84 | 81 | 88 |
| 16 | Cincinnati Bengals | 84 | 80 | 88 |
| 17 | Jacksonville Jaguars | 82 | 91 | 72 |
| 18 | San Francisco 49ers | 81 | 83 | 79 |
| 19 | San Diego Chargers | 81 | 72 | 91 |
| 20 | Houston Texans | 80 | 71 | 90 |
| 21 | Philadelphia Eagles | 80 | 81 | 79 |
| 22 | Green Bay Packers | 79 | 92 | 67 |
| 23 | Kansas City Chiefs | 79 | 85 | 72 |
| 24 | Chicago Bears | 78 | 69 | 88 |
| 25 | Tampa Bay Buccaneers | 77 | 72 | 83 |
| 26 | Buffalo Bills | 76 | 85 | 68 |
| 27 | Pittsburgh Steelers | 75 | 81 | 67 |
| 28 | Detroit Lions | 75 | 76 | 74 |
| 29 | Oakland Raiders | 74 | 79 | 69 |
| 30 | Seattle Seahawks | 73 | 72 | 74 |
| 31 | St. Louis Rams | 73 | 75 | 71 |
| 32 | Washington Redskins | 72 | 74 | 69 |
For more information on each offensive lineman, check out the individual ratings in Football Mogul.
Sunday, January 24, 2010
Fixing Overtime In The NFL (Revisited)
We already have a great solution to the problem of the coin flip in overtime games. Nevertheless, it has been almost four years, and we're still stuck with the old system.
After the Vikings-Saints NFC Championship game (and the Colts' failed attempt to go 16-0) the argument for this change to the rules is even more compelling. If this rule had been implemented, both the Saints and the Colts would have still had something to play for in the last month of the season.
To summarize, we can fix the following two problems with one rule change:
1) The coin-flip winner has an unfair advantage in overtime.
2) Teams like the 13-0 Saints and 14-0 Colts have no incentive to win after they have clinched the top playoff spot.
The solution is elegantly simple: automatically award the coin flip to the home team.
In addition to eliminating the coin flip, there are a number of other positive effects:
After the Vikings-Saints NFC Championship game (and the Colts' failed attempt to go 16-0) the argument for this change to the rules is even more compelling. If this rule had been implemented, both the Saints and the Colts would have still had something to play for in the last month of the season.
To summarize, we can fix the following two problems with one rule change:
1) The coin-flip winner has an unfair advantage in overtime.
2) Teams like the 13-0 Saints and 14-0 Colts have no incentive to win after they have clinched the top playoff spot.
The solution is elegantly simple: automatically award the coin flip to the home team.
In addition to eliminating the coin flip, there are a number of other positive effects:
1) This increases the importance of home field advantage in the playoffs. If a team like the Colts go 14-2, they get an edge if a playoff game goes to overtime (just as the home team in baseball has a strategic advantage).
2) We now know who the "home team" is in the Super Bowl. And it matters. This would have been pivotal this season: the Colts and Saints would continue to play hard, knowing that if they met in the Super Bowl, home-field advantage would be determined by their regular-season record. Instead, we got five unwatchable games by two teams that had nothing to play for.
3) It adds drama to the final minutes of a game, and clarifies strategy for coaches. If you're the away team, and you're up against a good offense, you want to play for the win, not the tie, in any last-minute play calls. You go for two if you have the chance. And you go for the touchdown instead of the field goal on 4th down. More excitement, and less overtime (which tends to run into the next game, which doesn't make most football fans happy).
4) It increases attendance. As the NFL becomes more fun to watch on TV, ticket sales are suffering. Giving the home team a bigger advantage increases the likelihood that a home-team fan will have a great experience at the stadium (by getting to see his or her team win).
Monday, January 11, 2010
Wes Welker For MVP
 |
| Photo by Mike Gil |
With Welker on the roster, the Pats were 7-0 at home this season. Without Welker, they lost in Foxboro to the Ravens, 33-14. It seems silly to pin a 19-point loss on an injury to one guy. But the evidence shows that Wes Welker turns Tom Brady from a "very good" quarterback into "the best quarterback ever".
Brady's career Passer Rating with Welker: 108.1. That's easily the best Passer Rating ever. It's not even close. According to Football Mogul, Steve Young has a career Passer Rating of 96.8. Peyton Manning and his vaunted four MVPs: just 95.2. Take Welker away from Brady and his career Passer Rating drops to 88.7, more than two points behind Chad Pennington!
The difference is just as stark in the playoffs. Brady's Passer Rating in playoff games with Welker is 97.1, including an amazing 70.6% overall completion rate. Without Welker, Brady's playoff Passer Rating is a mediocre 83.2. And the icing on this shit cake is a 49.1 Passer Rating in Sunday's game versus the Ravens.
Julian Edelman caught two touchdowns in Brady's first home playoff loss. But he didn't move the chains like Welker. And he didn't free up Moss to go deep. Brady spent a lot of time holding the ball and getting pressured, because he didn't have Wes to go to when he needed to.
For some final perspective, note that Matt Cassel's season with the Patriots (and with Welker) in 2008 was better than four of Brady's seasons without Welker. But it was worse than the seasons that Brady has had with Welker. So, Brady is better than Cassel. But Wes is better than both of them.
So, my vote for 2009 NFL MVP goes to Wesley Carter Welker. Without Wes, the Patriots may not have even made the playoffs this year. Tell Peyton to give back that trophy!
Subscribe to:
Posts (Atom)